減少區域生物質供應鏈的碳足跡

05-12, 2016
abstract 摘要
本文提出了區域能源目標和供應鏈合成的新方法。需求驅動的方法適用于評估在特定區域可再生資源為客戶傳遞能量的可行的方法。所研究的區域是通過使用發達區域能源聚類(REC)算法劃分成若干簇。該REC目標瞄準最大限度地降低系統的碳足跡(CFP)。區域資源管理復合曲線(RRMCC)的過程集成方法的比喻表示能量失衡幫助在交易關閉資源管理。這些圖形工具提供了如何在一個地區管理過剩的資源(生物質和土地利用)簡單的信息。 。 2009年保留的愛思唯爾B.V.所有權利。A new method for regional energy targeting and supply chain synthesis is presented. A demand-driven approach is applied to assess the feasible ways for transferring energy from renewable sources to customers in a given region. The studied region is partitioned into a number of clusters by using the developed Regional Energy Clustering (REC) algorithm. The REC targets aim at minimising the system carbon footprint (CFP). The biomass energy supply and management are targeted using new graphical representations. Regional Energy Surplus–Deficit Curves (RESDC) visualises the formation and the sizes of introduced energy clusters. Regional Resource Management Composite Curve (RRMCC) an analogy of the Process Integration approach shows the energy imbalances helping in trading-off resources management. These graphical tools provide straightforward information of how to manage the surplus resources (biomass and land use) in a region. . 2009 Elsevier B.V. All rights reserved.
1. Introduction 介紹
生物質能是關鍵的可再生能源(RES)之一。它是可以從中產生的熱,電和液體生物燃料一個多功能源。加緊生物利用率增加了供應鏈系統的復雜性,由于分布式生產的生物質作為能源。生物質資源和其通常低能量密度的分布特性所需要的供應鏈中的大的運輸能力。其結果是,區域能源供應鏈分析具有空間規劃的特點。一些以前的研究預測,生物質能的使用量將在未來顯著上升(WEA,2000; IEA,2005)。生物質供應電勢是由它的特征的限制,例如低能量密度(每單位體積的能量),高比用地(每單位面積的能量)和分布式生產。生物質的能源基礎設施通常是建立和比對化石燃料的操作更加昂貴。生物質資源分布在區域中的區域,并且通常只在偏遠地區。基礎設施建設在更長的距離傳輸生物質能往往會增加其成本。這種情況下將使生物質在嚴重的缺點在純經濟術語(Krotscheck等人,2000)。然而,由于生物質簡稱:熱電聯產,熱電聯產發電; REC,區域能源集群; RRMCC,區域資源管理綜合曲線; RES,可再生能源; RESDC,區域能源剩余赤字曲線。Biomass is one of the key Renewable Energy Sources (RES). It is a versatile source from which heat, electricity and liquid biofuels can be generated. Stepping up biomass utilisation increases the complexity of the supply chain systems due to distributed production of biomass as an energy source. The distributed nature of the biomass resources and its usual low energy density require large transportation capacity within the supply chain. As a result, regional energy supply chain analysis has the characteristics of spatial planning. Several previous studies have predicted that the usage of biomass will be increased significantly in the future (WEA, 2000; IEA, 2005). The biomass supply potential is constrained by its characteristics such as low energy density (energy per unit volume), high specific land use (energy per unit area) and distributed production. The biomass energy infrastructure is generally more expensive to build and operate than that for fossil fuels. Biomass resources are distributed over the area in a region and often available only in remote locations. Building infrastructure to transfer biomass energy over longer distances would tend to increase its cost. Such a scenario would put biomass at serious disadvantage in purely economic terms (Krotscheck et al., 2000). However, since biomass Abbreviations: CHP, combined heat and power generation; REC, Regional Energy Clustering; RRMCC, Regional Resource Management Composite Curve; RES, Renewable Energy Sources; RESDC, Regional Energy Surplus–Deficit Curves. offers the potential to reduce the environmental impact of energy supply, thus saving costs for reacting to natural disasters in the future. Moreover, especially in Europe, the security of energy supply is currently also of significant importance. Any extra energy generation from domestic sources would help in reducing the dependence on foreign imports of crude oil and natural gas, thus increasing the economic stability and in some cases improving significantly the foreign trade balances. Several indicators for evaluating environmental impacts of biomass process have been introduced such as sustainable process index (SPI) (Krotscheck et al., 2000; Sandholzer and Narodoslawsky, 2006), carbon footprint (Johnson, 2009) and environmental LCA studies (De Benedetto and Klemeˇs, 2009). A CFP is defined by POST (2006) as the total amount of CO2 and other greenhouse gases emitted over the full life cycle of a process or product. The CFP has become an important environmental protection indicator as most industrialized countries have committed to reduce their emissions of CO2 by an average of 5.2% in the period 2008–2010 in respect to the level of 1990 (Sayigh, 1999). CFP for biomass supply chain is the total CO2 amount emitted throughout the supply chain life cycle (Perry et al., 2008). Energy from biomass cannot be considered truly carbon-neutral even though the direct carbon emissions from combustion had been offset by carbon fixation during feedstock photosynthesis (Anderson and Fergusson, 2006). The net CFP is mainly caused by the indirect carbon emission generated along the supply chain itself. Especially transportation activities contribute the major part of the CFP in the supply chain (Forsberg, 2000). Typical location of biomass sources (farms, forest, etc.), the relatively low energy density (energy per unit volume) and the distributed nature of the sources require extensive infrastruc0921-3449/$ – see front matter . 2009 Elsevier B.V. All rights reserved. doi:10.1016/j.resconrec.2009.03.009 #p#分頁標題#e#
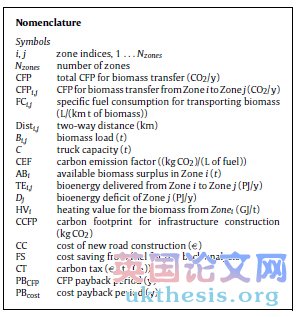
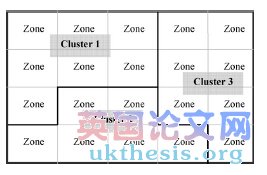
H.L. Lam et al. / Resources, Conservation and Recycling 54 (2010) 303–309 Nomenclature Symbols i, j zone indices, 1 ...Nzones Nzones number of zones CFP total CFP for biomass transfer (CO2/y) CFPi,j CFP for biomass transfer from Zone i to Zone j (CO2/y) FCi,j specific fuel consumption for transporting biomass (L/(km t of biomass)) Disti,j two-way distance (km) Bi,j biomass load (t) C truck capacity (t) CEF carbon emission factor ((kg CO2)/(L of fuel)) ABi available biomass surplus in Zone i (t) TEi,j bioenergy delivered from Zone i to Zone j (PJ/y) Dj bioenergy deficit of Zone j (PJ/y) HVi heating value for the biomass from Zonei (GJ/t) CCFP carbon footprint for infrastructure construction (kg CO2) CC cost of new road construction (D ) FS cost saving from fuel for pay back analysis CT carbon tax (D /(t CO2)) PBCFP CFP payback period (y) PBcost cost payback period (y) ture and huge transport capacity for biomass supply. For regional biomass supply chains road transport is the usual mode for collection and transportation of the fuel. As a result the heavy road transport increases the CFP of the biomass energy. With the growing demand for energy crops, agriculture production and the space for development and the land use management become an environmental and societal trade-off. The land required to grow energy crops and refine them into marketable fuels would result in negative effects on food price increases and deforestation (Koh and Ghazoul, 2008; WWF, 2002). This will lead to the loss of biodiversity and create a conflict between the atmospheric carbon balance and natural ecosystems (Huston and Marland, 2003). Several studies have been performed to improve the efficiency of biomass supply chains. In general they have been optimised with regard to their economic performance (Tatsiopoulos and Tolis, 2003; Gronalt and Rauch, 2007) and there are no significant/consistent approaches to reduce the environmental impact along the supply chain itself. Several studies related to CFP minimisation in energy planning have been completed. Perry et al. (2008) integrated waste and renewable energy to reduce the CFP. A locally integrated energy sector with heat and power has been proposed and analysed by using Total Site Targeting method by this work. Tan and Foo (2007) proposed an extended pinch analysis approach for carbon-constrained energy sector planning. The idea has been extended with cascade method (Lee et al., 2009). These studies are dealing with preliminary planning and are not provide the energy supply network between the source and sink points such as the biomass flows (directions and quantities) within the supply chain boundary. The minimisation of CFP over biomass supply chain is a next important step. To tackle this problem, a Regional Energy Clustering (REC) algorithm is being introduced. This algorithm combines the energy surpluses and deficits from various zones, which can be matched to form energy supply chain clusters. A set of energy clusters is formed with minimum total CFP and reduced energy waste. The result of the REC is illustrated in graphical representations extending the analysis to infrastructure design, managing the energy-land use trade-off. Fig. 1. Regional Energy Clusters. #p#分頁標題#e#
2. Motivation for Regional Energy Clustering 區域能量聚集的動因
Clustering is the partitioning of objects into a number of groups. Porter (1998) defines clusters as geographic concentrations of interconnected suppliers, services providers, associated institutions and customers in a region that compete but also co-operate. Clustering analysis has been widely discussed as a tool to improve the basis of regional competition and co-operation. It has been applied in the areas of marketing development, manufacturing and supply chain network design (Srinivasa and Moon, 1999; Beckeman and Skjoldebrand, 2007). The introduction of clustering approach has been emerging recently in the field of energy supply chains. In this work, a cluster is defined as a set of zones related through energy transfer links using local infrastructures. The benefits of the proposed clustering are: -Partitioning of the solution space and problem decomposition. This allows breaking down the initial complex problem into several problems of smaller size and complexity, greatly facilitating the modelling and solution efforts. -Reducing the scope and size of the problems to consider allows adding more details and precision to the process models, thus increasing the confidence in the resulting supply chain networks. Forming clusters reveal the sets of zones, between which the biomass transfer is most beneficial. The current criterion used for clustering is to minimise the CFP. Since at this stage only biomass exchange is considered, CFP minimisation tends to also minimise the costs. A cluster combines smaller zones to secure sufficient energy balance within the cluster (Lam et al., 2008). A zone can be a province/county, a community settlement/borough, an industrial park or an agriculture compound from the studied region. The REC is used to manage the energy balancing among the zones. The energy surpluses and deficits from various zones can be matched and combined to form energy supply chain clusters as shown in Fig. 1.


3. Methodology 方法論
There are 5 main steps for minimising CFP of regional biomass supply chains: (i) Identification of the region for analysis and the corresponding zones within it. The region is taken as an administrative unit. This can be a set of countries (e.g. Central Europe), a set of counties forming an administratively recognisable region (e.g. the K.zép-Dunántúl region in Hungary). The zones are smaller administrative areas within the region, accounting for any administrative or economic boundaries (e.g. a county). #p#分頁標題#e#
H.L. Lam et al. / Resources, Conservation and Recycling 54 (2010) 303–309 However, a zone could be also defined by the economy—by economic grouping and interconnections. (ii) Mathematical formulation for REC algorithms. (iii) Regional Energy Surplus–Deficit Curves (RESDC). (iv) Regional Resource Management Composite Curve (RRMCC). (v) CFP (and potential also economical) pay back analysis. Generating a biomass transfer network is an optimisation task to determine the links and the biomass flows from the available energy source points to the target sink points. This is followed by the step which groups the zones into the suitable clusters. The RESDC is a pair of cumulative curves which represent cumulative energy surplus and deficit profiles. It indicates the size of each cluster and the total energy involved in the supply chain within the cluster. The information of the clusters can be further illustrated in RRMCC which shows the amount of imbalance energy within the cluster and provides the information of possible extra land use. The CFP pay back analysis can be applied to assess projects for retrofit or creation of new infrastructure in the supply chain network. In many cases the economy has been a decisive criterion and economical pay back figures can be analysed and used as a trade-off to the CFP.
3.1. Mathematical formulation for REC algorithms
The suggested procedure for the REC algorithm is: (i) Tabulate the energy source and demand data. The table has to contain the quantity of the potential energy sources, the bioenergy demand and the locations of the collection. The biomass resources surpluses and deficits should be obtained from analysis of the local sources and demands inside each zone. Distribution centroid is specified by 2D Cartesian coordinate system and the centroid point for Zone 1 is marked as reference point. (ii) Obtain an optimised targeting result for the biomass transfer network/link using Linear Programming. The objective is to minimise the total CFP within the boundary of the given region. For biomass transfer from Zone i (source) to Zone j (sink) varying i =1 ... Nzones; j =1 ... Nzones, i =/j, the following objective function is defined: Min CFP = CFPi,j (1) ij Bi,jCFPi,j = FCi,j × Disti,j ×× CEF (2)C where CFPi,j is the carbon foot print, FCi,j the fuel consumption, Disti,j the two-way distance, Bi,j the biomass load, C the truck capacity, and CEF is the carbon emission factor for diesel trucks. The following constrains are necessary: (a) The total amount of biomass transported out from Zonei to other zones cannot exceed the available surplus ABi (Eq. (3)) and flows for transferring biomass to the same zone are forbidden (Eq. (4)): Bi,j ≤ ABi .i (3) j Bi,j i=j = 0 (4) (b) The total bioenergy delivered to Zonej cannot exceed the deficit in that zone: TEi,j ≤ Dj .j (5) i TEi,j = HVi × Bi,j (6) HVi is the heating value for the particular biomass from Zonei and Dj is the total deficit in Zonej. (c) The biomass load in the system must be non-negative: Bi,j ≥ 0 .i, j (7) (iii) Clusters are formed based on the priority that the residual bioenergy imbalance within the newly formed clusters, is minimised (preferably zero) by using Mixed Integer Linear Programming (MILP).#p#分頁標題#e#
3.2. Regional
Energy Surplus–Deficit Curves The steps to plot RESDC are: (i) Arrange the zones within each cluster in descending order according to their energy balance, starting with the largest surplus. (ii) Illustrate the clustering result with a pair of monotonic cumulative curves. Plot the energy supply cumulative curve with the cumulative area as x-axis and the accumulated energy balance on the y-axis. The cluster with the smallest imbalance will be the first cluster. (iii) Plot the energy demand cumulative curve in the same manner as step (ii).
3.3. Regional Resource
Management Composite Curve The RRMCC can be plotted in the same way of RESDC, but replace with a single energy balance (surplus or deficit) cumulative curve instead of a pair of supply–demand curves.
3.4. CFP pay back analysis
The need to reduce CO2 emission motivates the suggestion of constructing an alternative transportation route (road, railway or water transportation) which could reduce the transportation CFP and cost. Pay back analysis is a method to determine the break-even point when an investment cost and the CFP from the construction will generate a positive return. It is used to evaluate the environmental and economic trade-off. This method assesses the consequences of the alternative route construction cost and CFP comparing with the existing condition. The equations for CFP pay back (PBCFP) and cost pay back (PBcost) analysis are given in Eqs. (8) and (9): PBCFP = CCFP CFP . CFP. (8) PBcost = CC FS + CT (9) where CCFP is the Construction CFP, CFP* is the CFP of the new road. CC is the cost of new road construction, FS is the cost saving from fuel due to the shorter distance, and CT is the carbon tax for the diesel.
4. Demonstration case study 實證案例研究
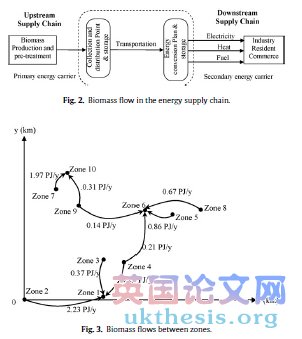
The study is focusing the biomass transportation network. The upstream (biomass production) and downstream (biomass combustion and energy conversion technology) are beyond the scope of the study as they are not directly related to the biomass flow network optimisation. The case study considers energy consumers to be the local community in the studied region. The surplus of biomass is transported from the collection point nearby the farm and sent to the biomass energy conversion plant to support the regional energy demand. The co-generation power plant (CHP) and
H.L. Lam et al. / Resources, Conservation and Recycling 54 (2010) 303–309 Fig.2.Biomass flow in the energy supply chain. Fig. 3. Biomass flows between zones. biofuel boiler are normally used for regional energy conversion system. The electricity produced is supplied to the national grid. The generated heat is used for domestic, commercial and industrial applications, mainly for space heating and hot utilities generating (Fig. 2). The information of potential biomass sources, the area and location of the collection point for a particular zone are shown in Table 1. They were collected from a generalised Central European region. The potential biomass their heating value and total potential energy is given. The demand of biomass energy includes the usage for domestic direct burning, centralized heating system and CHP. The assumptions for major parameters are: (i) Carbon emission factor, CEF = 2.69 (kg CO2)/L (IEA, 2005). (ii) Fuel consumption by a 20 t trailer truck = 0.3 L/km. (iii) The road bending and level differences increase 30% of the direct distance. #p#分頁標題#e#
5. Results and discussion 結果與討論
A biomass flows solution for the case study is generated from the data in Table 1 and presented in Fig. 3. The diagram is plotted in 2D Cartesian coordinate system. It shows the location of the zone and Table 1 Data for case studies. Fig. 4. Regional Energy Supply–Demand Curves. the “ ” represented as its centroid. The biomass flow is represented by the arrow which gives the direction and the quantity of the flow. Clusters have been identified based on the result of biomass flows and illustrated in the RESDC (Fig. 4). In this case, the studied region is partitioned into 3 clusters. Zones 1, 2, 3 and 4 are grouped to become Cluster 1, Zones 5, 6, and 8 for Cluster 2 and Zones 6, 9 and 10 for Cluster 3. The solid line is the cumulative supply curve, and the dashed line represents the cumulative demand. Fig. 4 indicates the size of each cluster and the total energy involved in the supply chain within the cluster. Since each cluster is a group of stringer lines, this provides an opportunity to develop efficient energy planning and management strategies within a simpler supply chain compared to the whole region network. Currently, only minimisation of CFP is used as the criterion. In cases of degeneracy, additional judgement should indeed be used such as availability and quality of the available of infrastructure, which is implicitly linked to cost and CFP of its construction. The visual analysis of the REC result is further illustrated in the RRMCC as shown in Fig. 5. This kind of Composite Curve provides straightforward and valuable information for energy surplus/deficit planning as well as land use management. The quantity of the energy and the area of the zone are showing on the x-axis and y-axis respectively. The zones with positive slope supply the biomass to the demanding zones which is with the negative slope. Each of the left-hand turning points (could be also called a Cluster Pinch) indicates the start of a new cluster. The cluster will have surplus of biomass energy if the “turning point” for certain cluster is on the right-hand side of the y-axis, otherwise the cluster will have energy deficit.
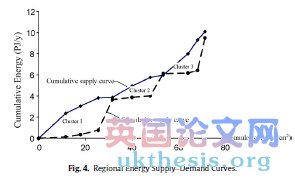

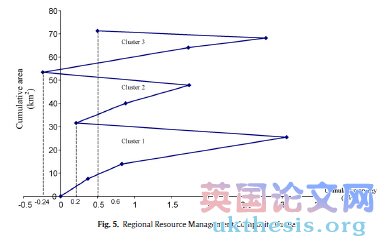
Fig. 5 shows that, the studied region has total energy surplus of 0.5 PJ/y. The energy balance for particular cluster can be obtained by shifting their lower turning point to the y-axis, which the cumulative energy starts from zero. In this case Cluster 1 has 0.21 PJ/y of energy surplus, Cluster 2 has deficit energy of 0.44 PJ/y and Cluster 3 has surplus for 0.74 PJ/y. The slope of RRMCC represents the land area (km2) required per unit energy (PJ/y). This relationship gives the option to the planner Zi Area (km2) Location (km, km) Potential biomass (t/y) Heating value (GJ/t) Supply (PJ/y) Demand (PJ/y) 1 6.12 (0, 0) 2,924 17.1 0.05 2.90 2 11.60 (4.1, 0.2) 135,082 17.4 2.35 0.12 3 9.58 (4.4, 2.5) 56,512 13.5 0.78 0.41 4 6.35 (5.3, 2.4) 45,511 15.4 0.70 0.23 5 8.38 (7.9, 5.1) 56,309 19.0 1.07 0.21 6 5.57 (6.4, 5.5) 15,179 14.5 0.22 2.20 7 10.63 (2.4, 6.8) 103,065 19.6 2.02 0.05 8 7.83 (9.4, 5.5) 58,990 13.9 0.82 0.15 9 4.12 (3.2, 6.6) 63,904 20.5 1.31 0.26 10 3.15 (2.3, 7.3) 44,826 17.4 0.78 3.06 #p#分頁標題#e#


Fig. 5 shows that, the studied region has total energy surplus of 0.5 PJ/y. The energy balance for particular cluster can be obtained by shifting their lower turning point to the y-axis, which the cumulative energy starts from zero. In this case Cluster 1 has 0.21 PJ/y of energy surplus, Cluster 2 has deficit energy of 0.44 PJ/y and Cluster 3 has surplus for 0.74 PJ/y. The slope of RRMCC represents the land area (km2) required per unit energy (PJ/y). This relationship gives the option to the planner Zi Area (km2) Location (km, km) Potential biomass (t/y) Heating value (GJ/t) Supply (PJ/y) Demand (PJ/y) 1 6.12 (0, 0) 2,924 17.1 0.05 2.90 2 11.60 (4.1, 0.2) 135,082 17.4 2.35 0.12 3 9.58 (4.4, 2.5) 56,512 13.5 0.78 0.41 4 6.35 (5.3, 2.4) 45,511 15.4 0.70 0.23 5 8.38 (7.9, 5.1) 56,309 19.0 1.07 0.21 6 5.57 (6.4, 5.5) 15,179 14.5 0.22 2.20 7 10.63 (2.4, 6.8) 103,065 19.6 2.02 0.05 8 7.83 (9.4, 5.5) 58,990 13.9 0.82 0.15 9 4.12 (3.2, 6.6) 63,904 20.5 1.31 0.26 10 3.15 (2.3, 7.3) 44,826 17.4 0.78 3.06 #p#分頁標題#e#
H.L. Lam et al. / Resources, Conservation and Recycling 54 (2010) 303–309 Fig. 5. Regional Resource Management Composite Curve. to assess the priority: either to sell the surplus energy on the fuel market or use the land for other purposes. This case, demonstrates how to apply RRMCC to maximise the free land and biofuel and at the same time to recover the deficit in Cluster 2. The lower turning point of Cluster 2 is shifted to left and touching the y-axis as shown in Fig. 6.
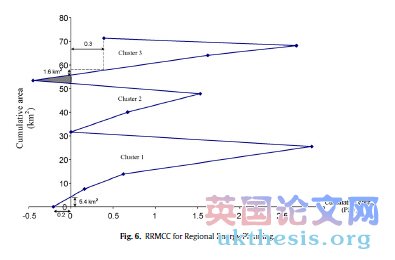
The curve with the positive slope on the left-hand side of y-axis represents the surplus from Cluster 1. The shaded triangle represents the deficit from Cluster 2. The opening gap on the top represents the net surplus for Cluster 3 after supplying Cluster 2 with required energy. As a result the region still has a total of 0.5 PJ/y which is 0.2 from Cluster 1 and 0.3 from Cluster 3. Anyhow RRMCC provides the options for resources (biomass and land use) management. For example, in Cluster 1, the decision makers can either export 0.2 PJ/y of biomass energy to the fuel market or free 5.4 km2 of available land for other purposes. The decision can be based on a judgement of the need of the market demand and the land use characteristics (Wang et al., 2003; Verburg et al., 2004). Usually there is already some infrastructure in place in each region. Therefore, one useful tool of evaluating the potential benefits of optimising the supply chain is the pay back analysis for infrastructure investments. For example, let us assume that 1 km of new road is to be built between Zone 1 and Zone 2, which will shorten the transportation distance by 0.3 km. The pay back analysis for 1 km new road construction is carried out based on the below assumptions: (i) CFP for 1 km alternative road construction = 18,000 kg CO2 (Olsson et al., 2006). (ii) The trucks for biomass transportation used 10% of the road capacity. (iii) The CFP for road maintenances are the same for existing road and the alternative road, therefore they will be cancelled out in the calculation. (iv) Cost for 1 km alternative road construction = 10,000D (Jaarsma and van Dijk, 2002). (v) Carbon tax = 15 D /(t CO2). (vi) Diesel price = 1 D /L.
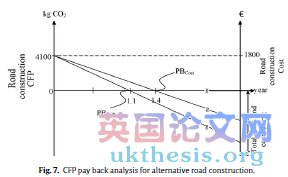
Fig. 7 demonstrates the pay back period for construction cost and CFP are 1.1 y and 1.4 y respectively. These figures depend on the cost level and can change with their fluctuation. However, the selected case study should provide a basic information for the price values selected. This shows that the alternative road will take longer period to generate the positive cost revenue compared to the positive CFP saving. The pay back period may change subject to the values of the parameters. Especially the pay back period in term of cost very much depends on the price of the fossil fuel. The PBcost will equal to the PBCFP when the price for fuel increases from 1.0 D to 1.32 D . The carbon tax contributes smaller contribution compared to the fuel price. It needs to be increased from 15 D /(t CO2)to129 D /(t CO2) in order to match the PBcost and PBCFP. The pay back analysis also Fig. 6. RRMCC for Regional Energy Planning. #p#分頁標題#e#

The curve with the positive slope on the left-hand side of y-axis represents the surplus from Cluster 1. The shaded triangle represents the deficit from Cluster 2. The opening gap on the top represents the net surplus for Cluster 3 after supplying Cluster 2 with required energy. As a result the region still has a total of 0.5 PJ/y which is 0.2 from Cluster 1 and 0.3 from Cluster 3. Anyhow RRMCC provides the options for resources (biomass and land use) management. For example, in Cluster 1, the decision makers can either export 0.2 PJ/y of biomass energy to the fuel market or free 5.4 km2 of available land for other purposes. The decision can be based on a judgement of the need of the market demand and the land use characteristics (Wang et al., 2003; Verburg et al., 2004). Usually there is already some infrastructure in place in each region. Therefore, one useful tool of evaluating the potential benefits of optimising the supply chain is the pay back analysis for infrastructure investments. For example, let us assume that 1 km of new road is to be built between Zone 1 and Zone 2, which will shorten the transportation distance by 0.3 km. The pay back analysis for 1 km new road construction is carried out based on the below assumptions: (i) CFP for 1 km alternative road construction = 18,000 kg CO2 (Olsson et al., 2006). (ii) The trucks for biomass transportation used 10% of the road capacity. (iii) The CFP for road maintenances are the same for existing road and the alternative road, therefore they will be cancelled out in the calculation. (iv) Cost for 1 km alternative road construction = 10,000D (Jaarsma and van Dijk, 2002). (v) Carbon tax = 15 D /(t CO2). (vi) Diesel price = 1 D /L.

Fig. 7 demonstrates the pay back period for construction cost and CFP are 1.1 y and 1.4 y respectively. These figures depend on the cost level and can change with their fluctuation. However, the selected case study should provide a basic information for the price values selected. This shows that the alternative road will take longer period to generate the positive cost revenue compared to the positive CFP saving. The pay back period may change subject to the values of the parameters. Especially the pay back period in term of cost very much depends on the price of the fossil fuel. The PBcost will equal to the PBCFP when the price for fuel increases from 1.0 D to 1.32 D . The carbon tax contributes smaller contribution compared to the fuel price. It needs to be increased from 15 D /(t CO2)to129 D /(t CO2) in order to match the PBcost and PBCFP. The pay back analysis also Fig. 6. RRMCC for Regional Energy Planning. #p#分頁標題#e#
H.L. Lam et al. / Resources, Conservation and Recycling 54 (2010) 303–309 Fig. 7. CFP pay back analysis for alternative road construction. provides the information of total cost and CFP saving for required period which is one of the important decision making factors in infrastructure management. The result of CFP pay back analysis for every possible link can be ranked and it gives the priority of which option of infrastructure should be considered first in the regional planning.
6. Conclusions and future work 結論與未來工作
A new procedure for Regional Energy Clustering has been developed and demonstrated with a case study on CFP minimisation and regional energy management. A set of biomass transfer flows with minimum CFP is given as the solution of the supply chain. The result is further analysed with graphical display which provides decision makers easier and faster solution rather than using mathematical calculation. After the optimised supply chain flows are obtained with the developed algorithm, a demonstration case shows that how the formation of energy clusters graphically represented by RESDC. This curve visually shows the grouping of energy cluster within the boundary of the supply and demand curves. This provides an opportunity to develop efficient energy planning and management strategies within a simpler supply chain compared to the whole region network. The energy planning and management is extended and illustrated in RRMCC. It provides straightforward information of how to manage the surplus resources (biomass and land use) in the region. CFP pay back analysis is applied to assess the suggestion of building alternative infrastructure in the cluster. The pay back period and the total saving of CFP and investment cost for construction can be used as the decision factors for regional planner. The CO2 emissions can be viewed as a kind of environmental cost, paid with the developing unstable climate. The CFP analysis, used for the bioenergy supply targeting, provided in the current paper, is based on estimating the CFP for biomass transfer between the zones in the studied region. CFP may originate from equipment building and infrastructure construction activities for the region. This can be referred to as “Creation CFP” and is analogous to investment costs. The remaining part of the CFP is associated with the activities for exploiting and operating the supply chain. This part of the CFP can be referred to as “Operational CFP”. The targeting method presented here uses the operational CFP. This is valid for a large number of cases. The validity of the target comes from the relative weight of the operational CFP ({operational CFP}/{total CFP}), which should be expected to be in the range of 0.75–0.85. For the particular case study above, the ratio is approximately 0.82. The REC approach is in the future work going to be extended to: (i) Multi-period case to account for variation in market and ambient condition. (ii) More complicated case to account the activities of energy import and export into the studied region by using RRMCC. (iii) Assessment of infrastructure retrofit by using the carbon pay back analysis. The “road construction case” illustrates the initial idea of superimposing on CFP payback over monetary payback. This work will be further developed in the future work. (iv) Integration of other type of renewable sources into the energy supply chain. (v) Synthesis of supply chain to manufacture biogas and liquid biofuel as alternative biomass products A proposed efficient synthesis and optimisation tools is P-graph algorithms (Friedler et al., 1992; Varbanov and Friedler, 2008). #p#分頁標題#e#
Acknowledgements 致謝
The financial support from the EC MC Chair (EXC): Integrated Waste to Energy Management to Prevent Global Warming— INEMAGLOW, MEXC-CT-2006-042618 is gratefully acknowledged.
References 文獻
Anderson GQA, Fergusson MJ. Energy from biomass in the UK: sources, processes and biodiversity implications. Ibis 2006;148:180–3. Beckeman M, Skjoldebrand C. Clsuter/networks promote food innovations. Journal of Food Engineering 2007;79:1418–25. De Benedetto L, Klemeˇs J. The environmental performance strategy map: an integrated LCA approach to support the strategic decision making process. Journal of Cleaner Production 2009;17:900–6. Forsberg G. Biomass energy transport. Analysis of bioenergy transport chains using life cycle inventory method. Biomass and Bioenergy 2000;19:17–30. Friedler F, Tarjan K, Huang YW, Fan LT. Combinatorial algorithms for process synthesis. Computers Chemical Engineering 1992;16:313–20. Gronalt M, Rauch P. Designing a regional forest fuel supply network. Biomass and Bioenergy 2007;21:393–402. Huston MA, Marland G. Carbon management and biodiversity. Journal of Environmental Management 2003;67:77–86. IEA, 2005. Emission facts: average carbon dioxide emissions resulting from gasoline and diesel fuelJaarsma CF, van Dijk T. Financing local rural road maintenance. Who should pay, what share and why? Transportation Research Part 1 2002;36:507–24. Johnson E. Goodbye to carbon neutral: getting biomass footprints rights. Environmental Impact Assessment Review 2009;29:165–8. Koh LP, Ghazoul J. Biofuel, biodiversity, and people: understanding the conflict and finding opportunities. Biological Conservation 2008;141:2450–60. Krotscheck C, K.nig F, Obernberger I. Ecological assessment of integrated bioenergy systems using the Sustainable Process Index. Biomass and Bioenergy 2000;18:341–68. Lam, H.L., Varbanov, P., Klemeˇs, J., 2008. Development of a graphical analysis method for renewable energy supply chain. In: Varbanov, P., Klemeˇs, J., Bulatov, I. (Eds.), Energy for Suistanable Future. UoP University Library Archives, UoP Press 2008/50, Veszprém, Hungary, pp. 209–218. ISBN 978-963-9696-38-9. Lee SC, Ng DKS, Foo DCY, Tan RR. Extended pinch targeting techniques for carbon-constrained energy sector planning. Applied Energy 2009;86(1):60–7. Olsson S, Karrman E, Gustafsson JP. Environmental systems, analysis of the use of bottom ash from incineration of municipal waste for road construction. Resources, Conservation and Recycling 2006;48:26–40. Parliamentary Office for Science and Technology (POST), 2006. Carbon footprint of electricity generation. (last accessed 03.12.08). Perry S, Klemeˇs J, Bulatov I. Integrating waste and renewable energy to reduce the carbon footprint of locally integrated energy sectors. Energy 2008;33:1489– 97. Porter ME. Cluster and the new economics of competition. Harvard Business Review 1998;November–December:76–90. Sandholzer D, Narodoslawsky M. SPIonExcel—fast and easy calculation of the Sustainable Process Index via computer, resources. Conservation and Recycling 2006;50(2007):130–42. Sayigh A. Renewable energy: the way forward. Applied Energy 1999;64:15–30. Srinivasa M, Moon YB. A comprehensive clustering algorithm for strategic analysis of supply chain network. Computers and Industrial Engineering 1999;36:615– 33. Tan RR, Foo DCY. Pinch analysis approach to carbon-constrained energy sector planning. Energy 2007;32:1422–9. Tatsiopoulos IP, Tolis AJ. Economic aspects of the cotton-stalk biomass logistics and comparison of supply chain methods. Biomass and Bioenergy 2003;24(3):199–214. Varbanov P, Friedler F. P-graph methodology for cost-effective reduction of carbon emissions involving fuel cell combined cycles. Applied Thermal Engineering 2008;28:2020–9. #p#分頁標題#e#
H.L. Lam et al. / Resources, Conservation and Recycling 54 (2010) 303–309 Verburg PH, de Nijs TCM, van Eck JR, Visser H, de Jong K. A method to analyse WEA, 2000. World energy assessment: energy and the challenge of sustainability. neighbourhood characteristics of land use patterns. Computers, Environment UNDP, UN-DESA and the World Energy Council United Nations Development and Urban Systems 2004;28:667–90. Programme, New York. Wang J, Fu B, Qiu Y, Chen L. Analysis on soil nutrient characteristics for sus-WWF, 2002. Oil farm plantations and deforestation in Indonesia: what role do Europe tainable land use in Danangou catchment of the Loess Plateau, China. Catena and Germany play? (last 2003;54:17–29. accessed 03.12.08).
